With every click on your organization’s website, every email open, every donation, every social media share, and every donor interaction, you collect valuable data. When managed and analyzed effectively, this data can provide insights into your nonprofit’s operations that help you identify areas for improvement and make positive changes.
The process of putting your data to good use is called nonprofit analytics, and when you master it, you will be well-equipped to use your data to fuel progress toward your organization’s goals.
In this guide, we’ll help you understand the basics of nonprofit analytics by covering:
- Nonprofit Analytics: An Overview
- Data Analytics for Nonprofits: Key Metrics
- How to Begin Analyzing Nonprofit Data
- How DNL OmniMedia Can Help
Harnessing the power of nonprofit analytics is not just about understanding numbers—it’s about transforming them into insights you can act on. This is why it’s essential to learn how to turn your data into something that doesn’t just sit in your constituent relationship management (CRM) system, but rather a tool that your team relies on each day to improve its work. Let’s begin!
Nonprofit Analytics: An Overview
What is nonprofit analytics?
Nonprofit analytics, also known as nonprofit data analytics or donor analytics, is the process of collecting raw data, managing it well, and analyzing it for insights.
Let’s break the process down into its three parts:
- Data Collection: There are several methods for collecting data, from recording donor details in individual profiles to sending out surveys or capturing information on event registration forms. Your various technology solutions, such as your email marketing platform or website analytics tool, may also provide you with data. Small nonprofits may store information in a few spreadsheets, but larger organizations will benefit from more robust tools like a CRM or, if they have multiple sources of data that need centralizing, a data warehouse.
- Data Management: Collecting massive amounts of data over time without ever taking the time to comb through and clean up that data can leave you with an unruly (and unhelpful) pile of information to dig through. Data management, also called data hygiene, involves conducting regular audits of your data to ensure accuracy, completeness, and relevance. Note that as you refine and standardize how you collect data, you can ensure clean and useable data from the beginning of the process.
- Data Analysis: During this part of the nonprofit analytics process, you’ll transform raw data into insightful and strategic information. To analyze your data, you’ll look for patterns and trends and compare current metrics to past benchmarks or projected targets. The right tools can make this easier for your team and more doable at a large scale. For example, if your nonprofit is trying to analyze its impact on those it serves, it may use a dedicated impact measurement and management (IMM) platform to uncover insights.
The ultimate goal of the nonprofit analytics process is to understand your organization’s performance in several areas, such as fundraising and donor engagement. As you uncover patterns and trends in your data, those insights can guide your team’s decision-making so that your organization can achieve its goals and work toward sustainable growth.
4 Types of Data Analytics
There are four primary types of data analytics that can benefit your nonprofit:
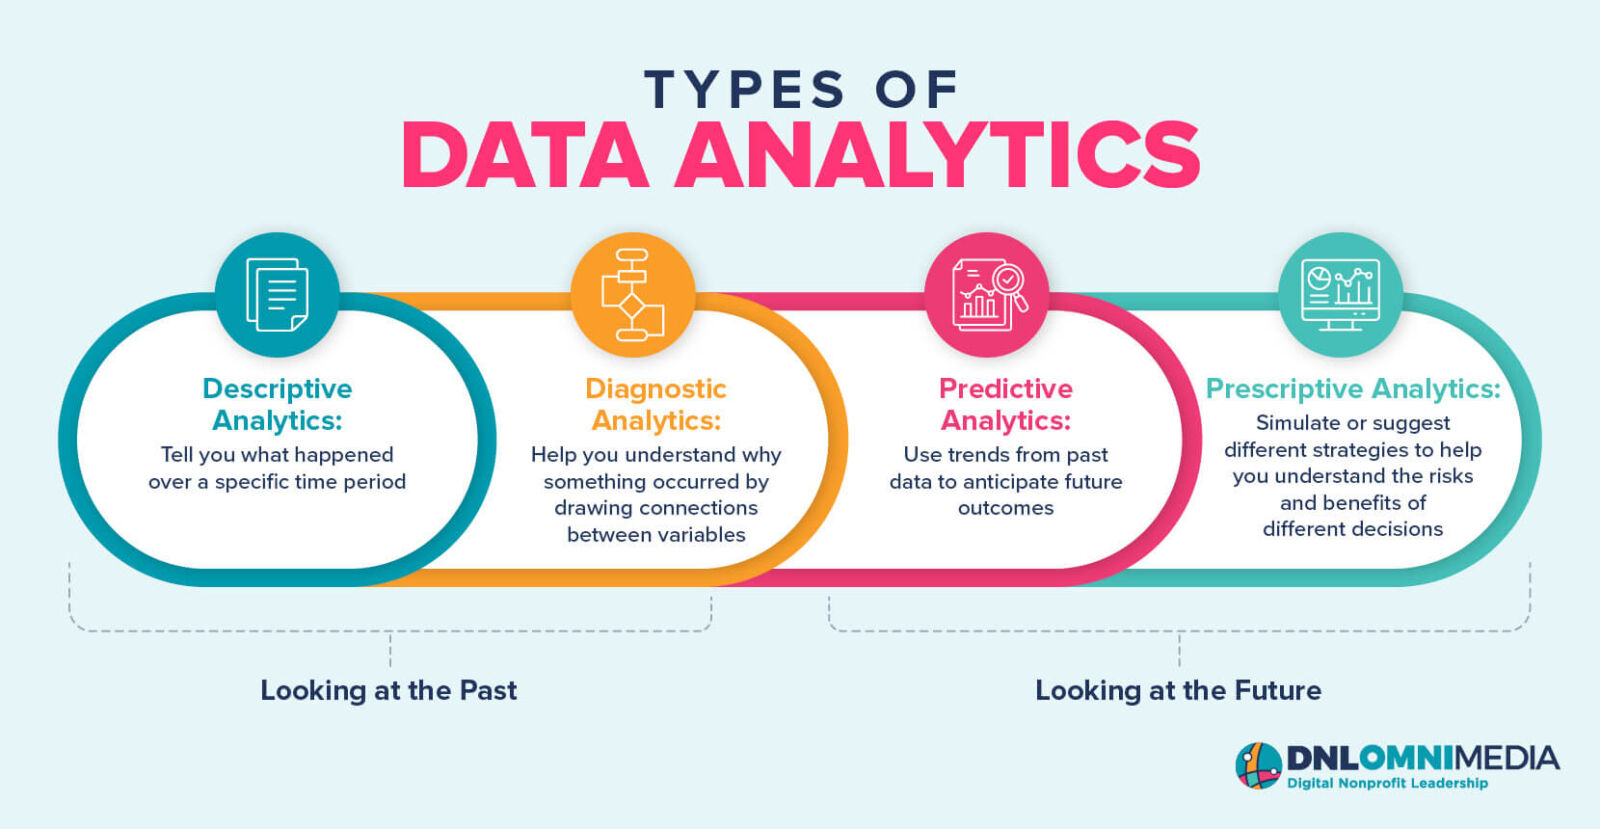
- Descriptive analytics, which describe what has happened over a specific time period, helping nonprofits see which changes have occurred and compare performance across time periods. For example, you can compare this year’s year-end giving campaign to last year’s.
- Diagnostic analytics, which help nonprofits understand why something occurred by drawing connections between multiple variables. For example, you can learn what impact, if any, a new communication channel had on fundraising outcomes.
- Predictive analytics, which involve using trends from past data to anticipate future outcomes. For example, if an organization wants to have better success with major donation asks, it might use predictive modeling to analyze past donor behavior and determine appropriate ask amounts for major donors.
- Prescriptive analytics, which simulate or suggest different strategies to help your team understand the risks and benefits of different decisions. For example, prescriptive analytics could help a nonprofit focused on natural disaster relief determine next actions, such as the right amount of supplies to send to an affected area.
As you can see, descriptive and diagnostic analytics focus on the past, while predictive and prescriptive analytics focus on the future. Using your data to understand what has already happened as well as what could happen will help you visualize your organization’s journey toward its goals and make more informed strategy decisions.
Why is data analytics important for nonprofits?
Data analytics is important because it allows organizations to reach their goals more effectively and efficiently. The process of analyzing a nonprofit’s data can improve several functions, including:
- Recruiting and retaining supporters (including donors, members, volunteers, and sponsors)
- Conducting donor research
- Making individual fundraising asks and running fundraising campaigns
- Optimizing marketing and communications strategies
- Improving community-facing programs and services
- Planning events
- Conducting advocacy activities
- Reporting on goals and maintaining accountability
- Creating grant applications and using grant funds effectively
- Budgeting and forecasting for future campaigns
- Planning for your organization’s future
Since your organization is likely working with limited resources, ensuring that you are allocating your resources in the best way possible will be critical to accomplishing your mission.
Data Analytics for Nonprofits: Key Metrics
Fundraising and Donor Analytics
There are a number of donor and fundraising-related metrics that your organization can store and analyze within your nonprofit database to find opportunities to improve your fundraising results. Depending on the capabilities of your software, you may need to add custom fields or configure your software to get the most comprehensive look at your unique data. A nonprofit technology expert can help you set up your database to monitor:
Engagement History
There is more than one way to engage with a nonprofit, and your interactions with supporters should reflect their unique engagement history and preferences.
Within your donor profiles in your database, you can store records relating to past donations and other transactions, event and program attendance, campaigns contributed to, volunteer shifts worked, and much more. Then, use that information to create segments within your donor list.
For example, you might create segments such as:
- Volunteers
- Members
- Recurring donors
- Event or program attendees
- Donors whose employers offer matching gift programs
- Corporate sponsors
- Online donors
- Mobile donors
You can even get more specific than this. For instance, you might break out your volunteer segment into additional segments such as first-time volunteers, lapsed volunteers, long-time volunteers, and volunteers who also donate. Or, you might segment donors by those who regularly give and those who have lapsed.
Segmentation allows you to create targeted fundraising and engagement strategies for specific subsets of your supporter list without having to manually sort through your whole database and hand-pick which supporters align with each new campaign or strategy.
Giving Habits
You likely wouldn’t ask someone who gives $10 annually to contribute a major gift to your nonprofit. Sure, they might agree, but it would make much more sense to solicit a donor whose past giving indicates that they’re capable and interested in making a major contribution.
A donor’s giving habits can tell you a lot, so take some time to analyze the past transactions stored in your donor database. Specifically, look at:
- Giving frequency. How often has a donor historically given? If they’re already making sporadic gifts throughout the year, it might be time to promote your recurring giving options or perhaps a membership program. If your donor only gives during the year-end season, you might find other ways to engage with them throughout the rest of the calendar year, like inviting them to your spring gala or golf tournament.
- Average gift size. How much a donor typically gives is one of the most common-sense ways to determine how much they’re comfortable donating. Pay attention to trends within a donor’s giving history, too. If you see that a donor’s gift size fluctuates, you might look into other factors that could be at play. For example, a donor may be more willing to pay $100 for a ticket to a fundraising event that really excites them, while their GivingTuesday gifts over the past few years cap out at $25. Or, you may see that members of your recurring giving program have responded well in the past to opportunities to increase the size of their regular gifts if the process for doing so is made easy.
- Preferred giving channels. Similarly, examine how your donors are making their gifts. With so many different ways to accept donations (online and off), your donors have more options than ever, and it’s important that you present the right supporters with the right options for giving. If a donor has given through a mobile donation form, for example, why not let them know about your text-to-give options?
Understanding a donor’s history leads to more successful donation solicitations, since you can tailor them to align with the donor’s past giving habits. Plus, once you know when, how, and how much a donor likes to give, you can more strategically encourage them to increase their gift or engage with your organization in a new way.
Industry Average
Research shows that the average online donation amount is $128, while the average annual donation total for recurring donors is $326. However, these averages will vary based on your nonprofit’s size and your donors’ giving habits. In this case, it’s better to calculate your own organization’s average rather than aspiring to an industry average.
Donor Retention Rate
Acquiring new donors is essential for your nonprofit’s growth. However, replacing your current donors with new ones due to lapse is expensive, time-intensive, and not conducive to growth.
Rather, nonprofits need to focus on retaining donors to grow. Retained donors form a reliable base of support, and their value usually improves over time as they become more invested in your cause and increase their donation amount.
Your donor retention rate indicates whether your donor engagement and stewardship strategies are successful. If your retention rates are low, ask yourself the following questions:
- How does your nonprofit prioritize ongoing supporter communications? Do you have a plan for re-engaging first-time donors after they make a gift? Do you communicate via donors’ preferred channels? Use your CRM to track individual donors’ preferences to ensure you reach out to them regularly and through the channels they prefer.
- Does your organization acknowledge donors quickly and genuinely? A thank-you email works well for small and mid-sized gifts, and there are simple strategies to make even these thank-you messages stand out. For example, you might experiment with eCards, which can add color, humor, and memorability to your outreach.
- Do you make it easy for donors to give on a regular basis? For example, you might encourage donors to set up recurring gifts rather than one-time donations.
The longer an individual is involved with your organization, the higher their lifetime value will be. When stewarded effectively, these donors can become regular event attendees, passionate advocates, and even reliable volunteers, all while slowly giving more over time with each donation upgrade request.
Industry Average
Tracking data across multiple years, the average donor retention rate usually varies from 40-45%.
Major Gift Indicators
Certain indicators can reveal how likely a donor is to make a major gift to your organization. This includes metrics such as:
- Wealth markers, or financial capacity indicators, like property ownership, stock ownership, and past political and charitable giving.
- Business affiliations, meaning where a donor works and what professional relationships they maintain. This is important for identifying opportunities to grow the donor’s impact, like if their employer offers a corporate philanthropy program.
- Affinity indicators, or characteristics that suggest a donor would be interested in giving a gift to your specific cause. Examples include past donations to your nonprofit and organizations like yours, a general history of charitable involvement, and personal details like values and life priorities.
Once you identify a donor with a high capacity to give and an affinity for your organization, you can begin stewarding them using your nonprofit’s established moves management process. Using metrics to identify prospective major donors ensures that no opportunities are overlooked.
Industry Average
On average, 88% of funding comes from 12% of donors. Be aware the percentage of funding from major donors depends heavily on the type of nonprofit. Smaller nonprofits have fewer major donors, and many major donors tend to give to foundations, which then distribute grants to nonprofits.
Donor Demographics
Donor demographics can tell you about who your donors are and how they may prefer to engage with your organization. To start analyzing demographics, track all of the following information in your CRM:
- Age
- Occupation and employer information
- Education level and history
- Income level
- Family data (i.e., marital status, number of children in their household, etc.)
With this information, you can understand the best ways to appeal to specific donors and which opportunities they may be interested in. You can also assess demographic trends within your database and adjust your strategies or various audience segements accordingly.
For example, let’s say you discover a large audience of younger, college-educated donors. You may then choose to orient a fundraising campaign around raising many small gifts, rather than a few major donations, to appeal to that cohort that may not yet have as much disposable income as its older counterparts.
Online Giving Rate
Your organization should measure how many gifts are coming in online versus through other offline channels, such as direct mail or in-person events. This is so you can invest in only the right online fundraising tools for your organization’s strategy, optimizing your investment to secure the most funds.
Remember that online giving goes beyond just an online donation form, including other channels such as:
- Mobile giving and text-to-give
- Peer-to-peer fundraising pages
- eCommerce stores
- Crowdfunding platforms
- Charity auctions
When you can see how much money you’re bringing in through each online channel, you can determine the profitability of each tool and map out a strategy that leverages the right software for your audience.
Industry Average
Reports find that the average percentage of online gifts depends on nonprofit size. Small organizations receive approximately 17% of their revenue from online sources, while large organizations only source 12.5% online. This is because, on average, 80-90% of nonprofit revenue comes from major donors, who tend to give through non-online methods.
Total Donations Raised Through Matching Gifts
Corporate matching gifts are an underused fundraising channel. However, these donations have the potential to double some of your donors’ gifts at no additional cost.
Matching gifts are donations made by your donors’ employers to match their gifts. For example, if an eligible donor gives your nonprofit $50, their employer might also donate $50, doubling the donor’s contribution and impact.
If your nonprofit is serious about increasing matching gift revenue, track and analyze relevant metrics, like:
- Total raised
- Percentage of donations matched
- Percentage of match-eligible donors
- Percentage of donors who pursue a matching gift
Improving these measurements depends largely on your matching gifts marketing and promotion efforts.
Industry Average
Research shows that approximately 10% of the average nonprofit’s donors are eligible for corporate matches. However, only 1.31% of contributions get matched. Leverage corporate giving tools, marketing strategies, and corporate relationships to raise your nonprofit’s matching gift revenue above this 1.31% average.
Donor Communication Preferences
Your organization’s relationship with your supporters is no different than any other relationship—you need to keep in touch in order to make it work.
There’s a fine line between staying at the front of a donor’s mind through active communication and overwhelming them with content they’re not interested in. To make matters even more complicated, that line can vary significantly from one person to the next.
The key to finding the right engagement strategy for each supporter lies in their individual set of communication preferences. Within your CRM, make sure you have a record of all of the following:
- Preferred communication channel. Does this supporter prefer direct mail, email, text message, or something else? Donors are more likely to engage with or respond to a communication channel they regularly use, so don’t waste time sending messages through a method they’re uncomfortable or unfamiliar with.
- Preferred communication frequency. Some donors don’t want to hear from your team every day, and that’s okay! Respect how often your supporters want to be contacted so that they don’t hit the “unsubscribe” button or toss your direct mail materials in the trash.
- Preferred types of content. Your nonprofit undoubtedly has a variety of programs and projects going on simultaneously, but that doesn’t mean all of your supporters will be interested in each one. Be aware of which topics interest your donor so you can send them relevant content, such as advocacy-related news, volunteer opportunities, updates about your nonprofit or campaigns, and more.
You can obtain this data in many ways, but the easiest way is to allow supporters to update their communication preferences. By giving your donors control over their own preferences and information, you mitigate the risk that your supporter profiles will be out of date or inaccurate. That way, supporters get exactly the content they want, exactly when and how they want it.
Web Analytics
Your nonprofit website is a major source of online donations as well as other engagement opportunities, from volunteer registrations to digital advocacy actions and much more. In order to optimize your site to receive the most traffic (and conversions), pay attention to how your site is currently performing.
Consider setting up a free Google Analytics account for your site if you haven’t already so that you can easily access the most vital website metrics. Let’s break down some of the most fundamental metrics to track in Google Analytics that any nonprofit can analyze.
Website Traffic Sources
Do you know how people end up on your website? The answer to this question can provide insight into how you appeal to prospective donors and market your nonprofit.
The following acquisition categories on Google Analytics can help you answer this question:
- Organic traffic. These are users who land on your site through a search engine like Google or Bing. If you’re seeing low organic traffic, it’s likely because your pages aren’t ranking for key terms that individuals are searching for. Implementing a strong nonprofit SEO strategy can help.
- Referral traffic. These are users who land on your site via a link on another site. This allows you to understand which external sites are driving the most traffic and what kind of users they send your way.
- Social traffic. This allows you to see which social media platforms are driving the most users to your website. You can even see which specific posts are sending the most visitors to your site.
Beyond understanding where site visitors are coming from, you can also see which pages they’re navigating to once they land on your website. That way, you can assess which pages are most popular for users who come via each traffic channel.
Industry Average
Overall, organic traffic is the single biggest driver of website traffic, with 44% of total traffic to nonprofit websites coming from organic visits.
Average Website Session Duration
If users are landing on your site and immediately leaving it, that suggests that the information on your site isn’t meeting the visitor’s needs. However, website session duration is most valuable when it’s considered in the context of other factors, such as:
- Traffic source. Are users from Google spending more time on your website than those who found it via a recent news article? Are Facebook users reading the blog posts they click through to?
- Landing page. Are certain pages seeing a high bounce rate? If so, it may be time to revamp certain pieces of content or redirect older pages to more relevant, updated content.
- Keyword. Are your landing pages answering users’ search queries? If users are leaving your pages quickly, it could signal that your content isn’t relevant to their needs.
Web session duration can differ drastically across different web pages. But, when you consider it in the context of these factors, you can discover where to begin optimizing your site.
Industry Average
Across all industries, Hubspot reports an average session duration of 54 seconds. For nonprofits, however, the industry standard is between two and three minutes.
Website Conversion Rate
Your website conversion rate describes how successfully your website turns visitors into actual supporters. With Google Analytics, you can set up a variety of goals that correspond to different user actions, such as:
- Making an online donation
- Signing up to volunteer
- Registering for an event
- Signing a petition
- Signing up for your newsletter
- Downloading a resource
You can break this data down even further to see which traffic sources are driving the most conversions, how many pages a user visits within their session before converting, and more.
Industry Average
While the majority of traffic to nonprofit websites comes from mobile visitors, desktop visitors have a higher conversion rate. According to M+R Benchmarks, on average, 16% of desktop visitors who click on your donation page will complete a donation, while only 10% of mobile visitors will. This is despite 52% of traffic coming from mobile devices and 48% from desktop users. This translates to 78% of nonprofit online revenue coming from desktop users and just 22% from mobile devices.
Spruce up your website by working with Team DNL!
Google Ads Analytics
If your nonprofit has a Google Grant, you’re aware of the different metrics you can track as part of a successful Google Grant management strategy. Integrate your Google Ads account with Google Analytics to see Ads data alongside your other site analytics.
While you can learn a lot from Ads data, we recommend starting by focusing on the following metrics:
- Clicks per campaign
- The total cost of each campaign
- Cost per click
- Percentage of visits that lead to goal conversions
- Number of pages a user visits on your site after clicking an ad
A Google Grant consulting team can help you dig into this data and make sense of it in order to reap the greatest return on your Google Grant.
Industry Average
The Google Ad Grant is free, meaning nonprofits using it will always have a positive return on investment. Search ads (like Google Ads) have the highest ROI for nonprofits that use paid advertising—$4.78.
Email Analytics
Email remains one of the most valuable channels for nonprofit marketing and supporter engagement. To determine whether your email efforts are paying off, you can investigate several performance indicators.
Depending on the email marketing platform you use, your team may have access to a variety of analytics. We’ll walk through the most common metrics here.
Email Click-Through Rate
The end game of an email marketing campaign is to get supporters to click through and engage with some other material. Email click-through rate measures the percentage of individuals who click through the links included in your emails.
To improve your click-through rate, investigate the content you’re sending and pay specific attention to the calls-to-action you’re including. Segmentation is key here, as it’s important that you only send engagement opportunities to relevant segments of your audience. For example, you wouldn’t want to send an email that encourages the reader to donate to a supporter who has just made a donation to your organization.
Industry Average
Average click-through rates vary by email platform. Getting Attention also analyzed these reports to find that Mailchimp has a 3.27% click-through rate, Mailerlite a 3.27%, and Constant Contact a 2.94% click-through rate for nonprofit membership organizations and 2.34% for nonprofit service organizations.
Email Conversion Rate
To get the most accurate view of how impactful your emails are for your overall strategies, consider the email conversion rate, or the percentage of supporters who complete the desired action after reading one of your emails.
Use your email provider and Google Analytics to understand how readily email opens convert into:
- Donations
- Volunteer sign-ups
- Advocacy actions
- Event registrations
As with web data, you can break this data down on a more granular level to understand which campaigns drive the most conversions. Then, you can replicate the strategies in that campaign to see continued success. And, if you’re struggling to draw useful insights from your email marketing analytics, remember that you can work with a nonprofit marketing consultant to ensure this data is put to use.
Industry Average
When it comes to fundraising emails, research shows that approximately 0.07% of recipients respond, while 1.4% respond to advocacy emails.
Average Amount Raised Per Email Campaign
If your organization relies on email as part of its fundraising strategy, it’s essential to understand the average amount you raise per email campaign. This allows you to improve your strategy from campaign to campaign and see better results.
For example, a low average amount raised might indicate you need to refine your email campaign calls to action or make the donation process easier. In situations like these, you may want to employ A/B testing, where you change only a few small elements between two versions of the same email and then test them on an audience of volunteers to see which version is more effective.
INdustry Average
According to Neon One, the average nonprofit raises nearly $5,600 per email campaign, or about $1.11 per contact. Smaller organizations raise a little over $3,500 per email campaign, but about $6.15 per contact.
Unsubscribe Rate
Unsubscribe rate is the percentage of recipients who unsubscribe from your email list after receiving one of your organization’s emails.
This metric can help you gauge the relevance and reception of your email content. If you have a high unsubscribe rate, that may signal that your content is not resonating well with your audience or that you’re sending emails too frequently.
One additional note about managing unsubscriptions: Ensure that you make the process of unsubscribing from your emails quick and easy. Though you don’t want to lose subscribers, doing this will leave a good impression on those who are opting out of your email list. As a result, you’ll pave the way for opportunities to successfully engage with them again down the road.
Industry Average
Unsubscribe rate will vary by organization. However, according to research by Constant Contact, there are three common reasons people opt out of email lists: they receive too many emails from the organization (69%), the content is no longer relevant to them (56%), and the content isn’t what they expected (51%).
Business and Financial Analytics
Even though nonprofits don’t operate in the same way as for-profit businesses, it’s important to remain mindful of key business and financial metrics to ensure you’re on track for success as an organization.
The following are two ways that nonprofits can measure financial stability using data.
Nonprofit Revenue Reliability
Just like a business, nonprofits need to have dependable sources of income in order to keep their lights on.
Look into your CRM to assess the status of your annual fund and measure your nonprofit’s revenue reliability year-over-year. You can pull reports on past years’ finances and use predictive analytics to answer important questions like:
- How much funding can you expect in the form of recurring gifts? Remember that these sustained gifts will need to be unrestricted so that you can use them for operating expenses rather than specific campaigns.
- Has your nonprofit had consistent surpluses in the past? If you’ve been inconsistently breaking even or losing money year over year, you may need to revamp your annual fundraising strategies or assess your operating budget.
- What are your key sources of annual fund income each year? Knowing where your funds come from can help you cut back on unnecessary efforts and funnel more resources toward marketing and fundraising strategies that pay off.
Once you have your budget in line, you’ll be better prepared to develop strategies for growing your annual fund so that your nonprofit can take on new campaigns, invest in powerful technology, and have an even greater impact on your community.
Cost Per Dollar Raised
One of the simplest ways to calculate your organization’s return on investment is by analyzing your cost per dollar raised (CPDR).
Divide the cost of your fundraiser or marketing effort by the amount it brought in. For example, if your direct mail appeals cost $100 to send and result in donations totaling $500, your cost per dollar raised would be $0.20.
You probably have a wide variety of efforts that yield positive returns, but that doesn’t mean all of those campaigns are equally profitable. You can analyze the CPDR to determine which efforts are worth a higher investment and which could be cut from your fundraising plan.
The main benefit of this metric is to serve as a guiding reference when analyzing your overall fundraising effectiveness. That way, you don’t end up sinking major resources into efforts that aren’t paying off.
Industry Average
There is no standard for what costs should be included when calculating the cost per dollar raised, making it difficult to find an industry average. For example, some nonprofits include administrative and overhead costs, like employee salaries and software subscription fees, into their CPDR, while others do not. However, in general, nonprofit professionals advise keeping a CPDR rate of $0.20.
How to Begin Analyzing Nonprofit Data
If your organization is ready to begin analyzing your data or simply is looking to refresh your current practices, consider the following tips:
- Choose the right metrics to measure and analyze. There are virtually unlimited metrics you can track— if you can collect the data, you can analyze it. However, not all metrics will be useful for your organization’s strategy. Only analyze those that will help your organization reach its goals, and choose those by working backward from your goals. For example, if you’re hoping to increase major gifts, focus on major gift-related metrics.
- Develop a process for collecting, tracking, and analyzing data. This includes building integrations between your various data-generating technology solutions and your CRM so that all of your data will flow into your most comprehensive database.
- Conduct data hygiene efforts to keep information clean. Remove duplicate entries, update incorrect and inaccurate information, and ensure all data is input in a standardized manner. While you may need to begin with one major “cleanup,” the goal should be to develop ongoing data hygiene procedures to maintain database integrity as you add more information.
- Partner with a nonprofit consultant with expertise in data analysis. This nonprofit consulting partner will bring both data analytics expertise and an unbiased perspective through which to view your data. Jump ahead to learn more about working with DNL OmniMedia!
Making Good Use of Your Analytics
Analyzing your nonprofit’s data is just the beginning. From there, you must act on your insights in order for data analytics to make a positive difference to your organization.
Begin by communicating your findings with your team and stakeholders. Be transparent about both your wins and challenges and the next steps you plan to take. With your team members, divvy up responsibilities to ensure positive changes are made in a timely manner.
For example, say you notice that traffic to your online donation page has dropped over the past few months. Let your team members know, and then do some digging to find out what might be affecting the page’s traffic and conversions. Once you have a list of changes to make, hand them over to your web developer or fundraising team and give them a deadline for implementing the changes. Track page data for a few more months to see if your improvements helped boost traffic and conversions.
This is another important aspect of using data analytics wisely—continuing to collect, manage, and analyze your data so that you can track your progress toward your goals. As you do this, you’ll develop a data-driven culture in your organization that allows you to make smart decisions on a daily basis that positively impact those you serve.
How DNL OmniMedia Can Help
At DNL OmniMedia, we’re a team of nonprofit technology experts who understand just how important it is to get your data working for you. We offer the following data analytics services to nonprofits:
- Analytics framework development
- Data review and analysis
- KPI identification and goal-setting
- Data mapping
- Data segmentation
- Google Analytics configuration, implementation, and audits
- Google Analytics standard and custom reporting
- Google Tag Manager implementations
- Conversion rate optimization
- A/B and multivariate testing
- Donation performance benchmarking
- Tableau and Excel performance dashboard reporting
Beyond these specific services, we can also help your organization optimize its technology stack so that all of your tools work together to help you collect and make sense of your data, whether that means helping you migrate to a new CRM or developing a custom website primed to capture information on visitor behavior.
Are you ready to unleash the power of your nonprofit’s data?
We’re ready to help.
Data is a broad topic, and your nonprofit can always expand its tracking efforts to grow your organization and deepen relationships with your supporters.
To learn more about how you can leverage technology to get more from your data, check out these resources from Team DNL:
- Building Your Nonprofit’s Digital Strategy: A Full Guide
- Navigating Nonprofit Data Warehouses: A Comprehensive Guide
- Blackbaud Fundraiser Performance Management: Full Guide